Dyno Correction Factors - Real Wheel Horsepower
- Nov 11, 2021
- 5 min read
We are going to delve deeper into the complicated world of correction factors, a series of equations that dynamometers can apply in order to "standardize" the horsepower and torque numbers that they produce. Before we jump in too deep, let's say this, correction factors aren't a scam and they weren't invented so that dyno operators could trick customers into thinking they picked up power when they didn't. Although that certainly doesn't mean that doesn't happen...more on that later. So then, why do they exist? Well, the short answer is that engines produce different power depending on the atmospheric conditions in which they are tested. The long answer is that people from all over the world enjoy, and can learn from, comparing dyno results (especially us magazine guys) and there would be no way to do that without correcting the numbers to a set of standard conditions.
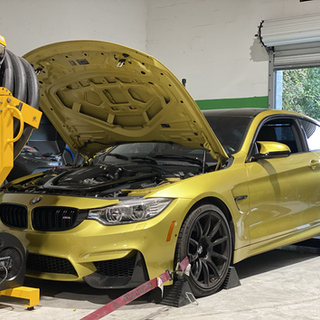
Test Vehicle We're going to use our '01 Camaro SS project, the STI Killer, for this testing. The Camaro features a GMPP LS6 crate engine, an SLP lid, a BBK throttle body and a set of BBK long-tube headers, which feed a Vengeance Racing/GMMG exhaust. This combination, with a basic tune, laid down 385.82 rear wheel horsepower and 370.45 lb-ft of torque on an 82.52-degree day with 61-percent humidity during our initial dyno testing, completed over 8 months ago.
Uncorrected Results After strapping the STI Killer down to the dyno, we brought the engine up to operating temperature (180-degree coolant, 170-degree oil) and hit record on our Dynojet 224xLC. With 81.30-degree air temperatures in the dyno cell, 29.53-inHg and 33-percent humidity, we recorded 399.03-rwhp and 383.99 lb-ft of torque, numbers almost perfectly inline with our initial testing. These uncorrected numbers represent exactly what the Camaro could put to the wheels on this day, during this test, without any additional arithmetic besides the typical horsepower and torque calculations that we explained last month in Real Wheel Horsepower, Part 1.
STD Correction STD, or standard correction, represents one of the oldest correction factors used by the Society of Automotive Engineers (SAE). STD is also known as J607 and it uses standard conditions of 60-degrees F, 29.92inHg and 0-percent humidity. For you engine dyno enthusiasts, these factors should look familiar, as STD (J607) is one of the most popular correction factors available and used almost exclusively by NASCAR teams to compare results from chassis dyno testing to results from the engine dyno. STD is also one of the most stable correction factors, in that it has not been changed for many years and the ideal factors remain consistent.
Applying this correction factor brings the STI Killer's recorded horsepower and torque to 410.84-rwhp and
395.35 lb-ft of torque, a "gain" of 11.81-hp and 11.36 lb-ft, or 2.95-percent. So, what gives? Well, remember that our uncorrected results were in a room that was 21.30-degrees warmer than the STD standard (81.30 vs. 60), with a slight loss in absolute pressure (29.53 vs. 29.92) and a 33-percent difference in humidity. There is a substantial amount of math here that could be done to figure everything out, but what is important to understand is the why, not the how of this correction factor. In practice, if the dyno cell were actually 60-degrees with 0-percent humidity and an absolute pressure of 29.92inHg, the engine would consume denser, cooler air and because of that, make more power. That's the entire idea of a correction factor, to standardize testing over various conditions.
SAE Correction SAE J1349 is the current gold standard of dyno testing and represents the newest widely accepted industry standard correction factor. Reengineered in 1990 (yeah, a long time ago), the SAE correction factor standardizes temperature to 77-degrees F, 29.23inHg and dry, 0-percent humid air. We exclusively use SAE correction when testing parts and cars here at GMHTP and your dyno operator probably does too. SAE, unlike uncorrected or STD, also uses a mechanical efficiency (friction) modifier in the correction factor, which assumes an 85-percent mechanical efficiency or a 15-percent differential in engine power due to frictional loss, which is fairly accurate in a standard all-motor application. Now, if you're thinking this means it reads 15-percent higher, that is not the case at all. In fact, SAE, due to the higher and more realistic standard temperature and absolute pressure factors will normally read 4-percent lower than a dyno graph printed in STD. It is important to note that there are other correction factors, but STD and SAE are the two most popular and commonly used (especially in the States). Looking at the STI Killer again and applying the SAE correction factor, we see that horsepower and torque move to 401.87-rwhp and 386.72 lb-ft of torque. Not much of a difference from the 399.03 we recorded using uncorrected numbers, but that is to be expected considering our dyno cell was only 4.3-degrees warmer than the 77-degree standard temperature and we added 33-percent humid air, with just a small (.30) gain in absolute pressure. According to Keith Lockliear of Dynojet Research, it takes approximately 40-percent humidity to move the correction factor by 1-percent, showing the SAE system puts much more emphasis on pressure and temperature than they do on humidity. We didn't quite see the "4-percent" difference from SAE to STD that we expected, although STD did still record higher by 2.183-percent, which is normal when comparing the two correction factors. Real Wheel Horsepower Understanding correction factors and the math involved can be a fun mental exercise, but the real point here is to understand how dyno graphs can be compared and what to do if you're comparing two graphs from similar cars tested in different environments. First and foremost, you need access to the original weather station data (Temp, Atmospheric Pressure, Humidity). Without this basic info, comparisons are impossible, so make sure you have it. Luckily, on any Dynojet, these numbers are sampled and recorded for every run and are always saved with each runfile, so if you don't have them handy, a quick call to your local dyno shop is all you need to get the weather station data. Secondly, you need to be able to see what correction factor was applied to your graph at the time it was printed. On any Dynojet graph, for example, you should see this information printed on the top right hand corner, where it will say something like "SAE, Smoothing 2." If you don't see these numbers on a graph you find on the Internet, start getting suspicious, you may be looking at an altered graph or, at the very least, something run with a strange correction factor to make the numbers look higher than they really are. This brings us to Phase 1 of Real Wheel Horsepower, giving you access to all weather station and correction factor data for testing you see in GM High Tech Performance. Not only will we be printing this information, we will also have it ready for you to download onto your home computer, so that you can mull over the graphs, change the correction factors and look at the weather data on each runfile, giving you a real feel for the tests, an unprecedented view of our testing and the ability to compare them to your own data.
Email: Service@tunedbytd.com
Phone/Text: 813-489-4101
Address: 7841 Leo Kidd Ave, Port Richey FL, 34668


Comments